
Real-Time Data Dashboards: Transforming Business Decision-Making with Live Insights


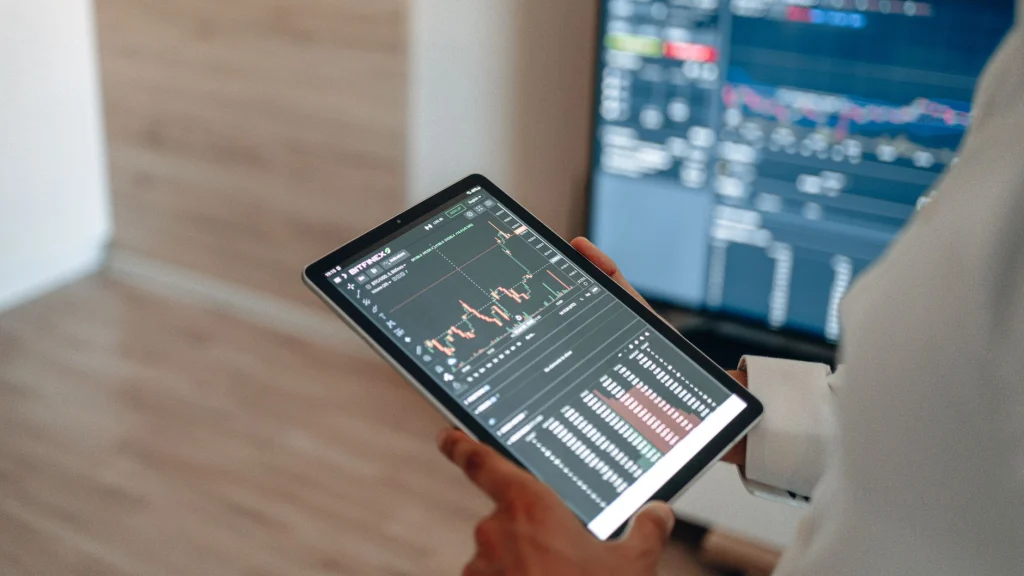
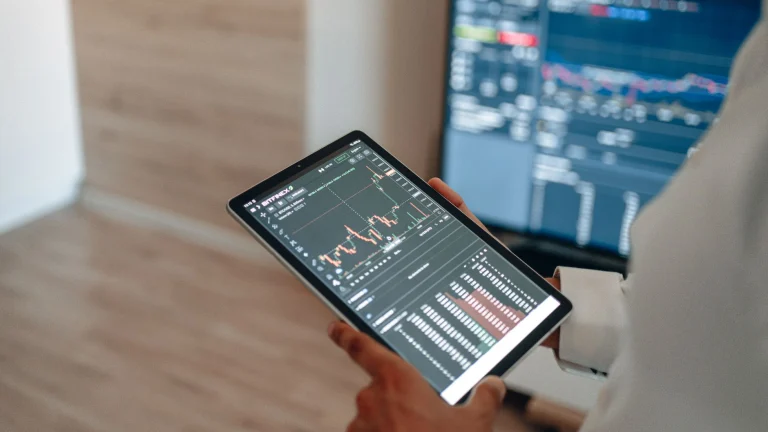
Real-time data dashboards give executives, managers and frontline staff instant visibility into key metrics. By pulling data from disparate sources and displaying it as it arrives, these dashboards turn static reports into dynamic decision‑making tools. In 2026, companies that adopt real-time dashboards gain a competitive edge through faster insights, improved operational efficiency and better customer experiences.
Table of Contents
- Real-Time Data Dashboards: Transforming Business Decision-Making with Live Insights
- Why Real-Time Data Dashboards Matter in 2026
- Core Components of an Effective Real-Time Data Dashboard
- Top Tools and Platforms for Building Real-Time Dashboards
- Best Practices for Designing User-Centric Dashboards
- Integrating AI and Predictive Analytics into Real-Time Dashboards
- Future Trends: Synthetic Data, Edge Computing, and Beyond
- Frequently Asked Questions
- Conclusion
Why Real-Time Data Dashboards Matter in 2026
Demand for instantaneous insights has surged as markets accelerate and customer expectations rise. Real-time dashboards provide a single source of truth, reducing the time spent reconciling data from multiple systems. According to intelegain.com, integrating advanced data management and analytics allows companies to access real-time insights, improving decision‑making across all stages (Nov 12, 2025). This immediacy translates into faster response times, lower costs, and higher revenue.
Competitive advantage is no longer about having the most data; it’s about having the most actionable data. Real-time dashboards enable teams to spot trends, detect anomalies, and pivot quickly. For example, a retail chain can adjust inventory levels on the fly when a sudden spike in demand appears, preventing stockouts and lost sales.
Core Components of an Effective Real-Time Data Dashboard
Building a robust dashboard ecosystem requires four core layers: data sources, ingestion pipelines, visualization layers, and alerting mechanisms.
- Data Sources – APIs, IoT sensors, cloud services, on-premises databases, and streaming platforms such as Kafka or Azure Event Hubs.
- Ingestion Pipelines – ETL or ELT processes that transform raw data into a query‑ready format. Real-time ingestion tools like Apache Flink or Snowflake’s Snowpipe enable low‑latency updates.
- Visualization Layer – Business intelligence tools (Power BI, Tableau, Looker) or custom dashboards built with libraries such as D3.js or Plotly.
- Alerting Mechanisms – Threshold‑based or AI‑driven alerts that notify users of anomalies or critical events via email, SMS, or chat integrations.
When these layers work together, dashboards deliver live data updates, predictive insights, and actionable alerts.
Top Tools and Platforms for Building Real-Time Dashboards
Several commercial and open-source solutions lead the market for real-time capabilities.
| Tool | Real-Time Feature | Integration | Pricing Model |
|---|---|---|---|
| Power BI | DirectQuery, live connections to Azure Synapse | Azure, Salesforce, SAP, etc. | Subscription (Pro, Premium per user) |
| Tableau | Live data source connections, Tableau Bridge | Cloud, on-prem, Hadoop, Snowflake | Per user subscription |
| Looker | LookML models, real-time exploration | BigQuery, Redshift, Snowflake | Subscription based on seats |
| Superset (Open Source) | SQLAlchemy connections, real-time dashboards | Any SQL‑compatible source | Free, hosting costs apply |
| Metabase | Live query execution, auto‑refresh | PostgreSQL, MySQL, MongoDB | Free, paid enterprise |
Each platform offers unique strengths. For example, Power BI’s integration with Microsoft Azure provides seamless live connections, while Tableau’s Bridge service enables real-time data from on-premise sources to the cloud.
Best Practices for Designing User-Centric Dashboards
Designing dashboards that users actually adopt requires careful attention to layout, KPI prioritization, and storytelling.
- Keep it Simple – Limit the number of visualizations to avoid clutter.
- Prioritize KPIs – Highlight the metrics that drive business outcomes.
- Use Interactive Elements – Filters, drill‑downs, and hover tooltips let users explore data on demand.
- Ensure Accessibility – Provide color‑blind friendly palettes and keyboard navigation.
- Validate Data Quality – Regularly audit source data to prevent misleading insights.
Following these guidelines increases user adoption and reduces the learning curve.
Integrating AI and Predictive Analytics into Real-Time Dashboards
AI enhances live dashboards by adding predictive and prescriptive layers. Predictive visual trend forecasting, as highlighted by fueler.io, generates forward‑looking trend lines directly inside dashboards (Jun 4, 2026). Machine learning models can detect anomalies in real time, triggering alerts before issues become critical. By embedding AI models into the visualization layer, dashboards transform from passive displays to proactive decision aids.
Future Trends: Synthetic Data, Edge Computing, and Beyond
Emerging technologies will shape the next wave of real-time dashboards.
- Synthetic Data Generation – LinkedIn notes that by 2024, 60% of data for AI and analytics solutions will be synthetically generated. Synthetic datasets enable faster model training and privacy‑preserving analytics.
- Edge Computing – Processing data closer to its source reduces latency, allowing dashboards to update in milliseconds.
- IoT Integration – The convergence of BI and IoT will enable real-time monitoring of physical assets, from manufacturing equipment to smart city infrastructure.
- Cross‑Platform Collaboration – Real-time dashboards will increasingly integrate with collaboration tools (Slack, Teams) for instant data sharing.
These trends promise dashboards that are faster, more secure, and more contextually rich.
Frequently Asked Questions
What is a real-time data dashboard?
A real-time data dashboard displays live data from connected sources, refreshing automatically as new information arrives. Unlike traditional reports that require manual refreshes, these dashboards provide continuous visibility into key metrics.
Which industries benefit most from real-time dashboards?
Finance, retail, manufacturing, healthcare, and logistics rely heavily on live data to monitor transactions, inventory, patient vitals, and supply chains. These sectors see the greatest gains in operational efficiency and customer satisfaction.
What are the main challenges in deploying real-time dashboards?
Data latency, integration complexity, and user training are common hurdles. Ensuring low‑latency pipelines and providing intuitive interfaces can mitigate these challenges.
How does AI enhance real-time dashboards?
AI adds predictive analytics, anomaly detection, and automated insights. By forecasting trends and flagging outliers, AI turns dashboards into proactive decision‑making tools.
What ROI can companies expect from real-time dashboards?
Companies often see faster decision cycles, cost reductions, and revenue growth. Metrics such as reduced downtime, improved inventory turnover, and higher customer retention illustrate tangible ROI.
Conclusion
Real-time data dashboards are no longer optional; they are essential for organizations that want to stay agile, data‑driven, and customer‑centric. By combining robust data pipelines, powerful visualization tools, and AI‑powered insights, businesses can transform raw data into actionable intelligence. As synthetic data, edge computing, and IoT integration mature, the next generation of dashboards will deliver even faster, more accurate, and more immersive decision‑support experiences.
Start by evaluating your data sources, choosing the right platform, and designing dashboards that focus on the metrics that matter most. With the right strategy, real-time dashboards can become the backbone of your organization’s decision‑making engine.