
Real-Time Data Dashboards for Business Decisions: Turning Live Data Into Instant Action
Every enterprise leader has felt the frustration of making a call on numbers that were already outdated by the time they reached the meeting room. Real-Time Data Dashboards for Business Decisions solve that exact problem by streaming live metrics from sales, marketing, operations, and customer support into a single, always-current view. Instead of waiting on end-of-week reports, teams can watch performance shift as it happens and respond while the opportunity — or the risk — is still fresh.
This shift matters because business speed is now a competitive differentiator. Companies that pair cloud systems, APIs, and enterprise automation with live dashboards make faster, more confident calls than those still relying on static spreadsheets. In this guide, we break down what real-time dashboards actually are, why they matter for modern SaaS platforms and enterprises, and how to implement them without stalling your team in complexity.
The shift toward continuous data visibility also reflects a broader change in how enterprises think about analytics. Business intelligence used to be a monthly ritual reserved for leadership review meetings. Today, it is an operational habit built into daily workflows, with dashboards acting as the connective layer between raw data and human judgment. Teams that embrace this habit tend to catch problems earlier, capitalize on trends faster, and reduce the guesswork that once defined budget and staffing decisions.
What Is a Real-Time Data Dashboard?
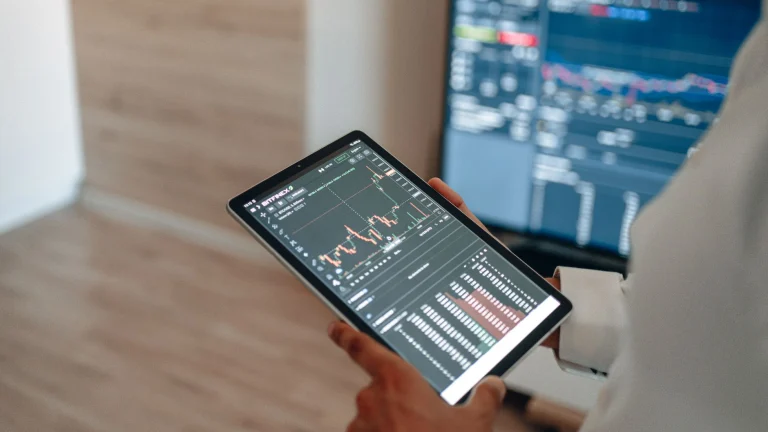
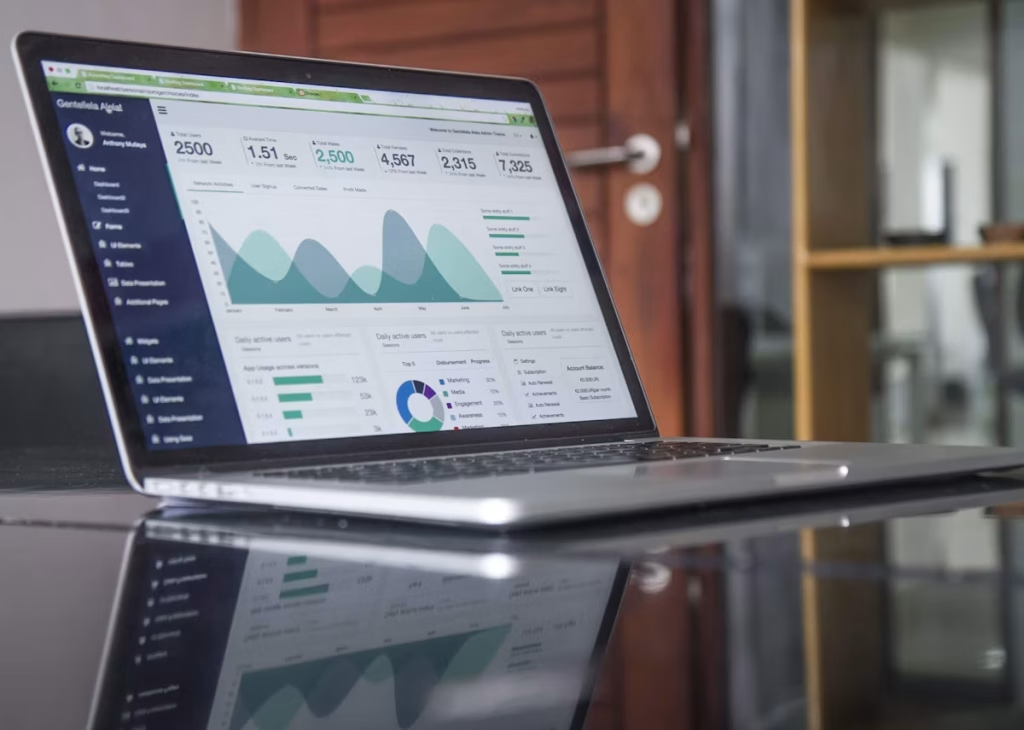
A real-time data dashboard is a visual interface that pulls information directly from operational systems — CRM platforms, payment processors, marketing tools, IoT sensors, or cloud databases — and displays it the moment it updates, often within seconds. Unlike traditional reporting, which batches data on a daily or weekly schedule, a real-time analytics dashboard reflects what is happening right now.
- Streams data continuously through APIs and event-driven pipelines
- Refreshes visuals automatically without manual exports
- Combines multiple data sources into one unified interface
- Surfaces alerts when metrics cross defined thresholds
Why Businesses Need Real-Time Data Dashboards for Business Decisions
Markets move quickly, and decision-making cycles that once took days now need to happen in hours. Real-Time Data Dashboards for Business Decisions give leadership teams a single source of truth that updates as customer behavior, inventory, and revenue shift. This is especially critical for SaaS startups managing churn signals and enterprise teams coordinating supply chains across regions.
Digital transformation initiatives increasingly depend on this kind of visibility. Instead of asking an analyst to pull a report, executives and managers can open a dashboard and see exactly where a campaign, product launch, or operational process stands. According to Gartner, organizations that prioritize real-time analytics consistently outperform peers still dependent on periodic reporting cycles.
How Real-Time Data Dashboards for Business Decisions Improve ROI
When teams see revenue, cost, and customer data update live, wasted spend gets identified faster and corrected before it compounds. This directly supports initiatives like reducing acquisition costs, a topic covered in depth in DTMetrix’s guide on How to Reduce Your Customer Acquisition Cost With AI.
Key Benefits of Real-Time Analytics Dashboards
Adopting a live dashboard strategy delivers measurable advantages across departments. The most significant benefits include:
- Faster response times — teams react to anomalies within minutes instead of days
- Improved accuracy — fewer manual exports mean fewer transcription errors
- Cross-functional alignment — sales, marketing, and operations view the same live numbers
- Stronger forecasting — live trend lines feed more reliable predictive models
- Reduced reporting overhead — analysts spend less time compiling static reports
These advantages compound when dashboards are connected to business intelligence dashboards already used for long-term planning, creating a bridge between day-to-day monitoring and strategic forecasting. Firms like IBM have documented similar gains among enterprises that unify operational and strategic data layers.

Real-Time Dashboards vs Traditional Reporting Tools
The gap between legacy reporting and live dashboards becomes clear when compared side by side. The table below breaks down the core differences enterprise teams should evaluate.
| Feature | Traditional Reporting | Real-Time Data Dashboards |
|---|---|---|
| Data Refresh Rate | Daily or weekly batch updates | Live, continuous streaming |
| Decision Speed | Delayed by report cycles | Immediate, in-the-moment action |
| Data Sources | Often single-source, manual exports | Multiple APIs and cloud systems integrated |
| Error Rate | Higher due to manual handling | Lower with automated pipelines |
| Alerting | Not typically available | Threshold-based automated alerts |
| Accessibility | Static PDFs or spreadsheets | Interactive, cloud-based, mobile-ready |
| Forecasting Support | Limited, backward-looking | Feeds predictive analytics models |
| Cost Over Time | Rising labor cost for manual reporting | Lower long-term operational cost |
| Team Collaboration | Siloed, department-specific | Shared, cross-functional visibility |
| Scalability | Difficult to scale across regions | Scales natively with cloud infrastructure |
Real-World Use Cases Across Industries
Real-time dashboards are no longer limited to tech companies. Across sectors, they are becoming core infrastructure for daily operations.
- eCommerce: Live inventory and conversion dashboards prevent stockouts and highlight underperforming product pages instantly.
- SaaS platforms: Product usage and churn-risk dashboards let customer success teams intervene before cancellation.
- Financial services: Transaction monitoring dashboards flag anomalies for fraud teams within seconds.
- Logistics: Fleet and shipment dashboards track delays and reroute resources in real time.
- Marketing teams: Live campaign dashboards connect ad spend to conversions, supporting the strategies outlined in How AI Analytics Transforms Digital Marketing in 2026.
Enterprise resource planning teams also rely on live dashboards to synchronize procurement, finance, and HR data, reducing the reporting lag that historically slowed cross-departmental decisions. Even customer relationship management teams benefit, since live pipeline dashboards let sales leaders spot stalled deals and reallocate follow-up effort before a quarter closes rather than after.

Implementation Challenges and Solutions
Rolling out live dashboards is not without friction. The most common obstacles include:
- Data silos: Disconnected CRM, ERP, and marketing tools prevent a unified view. Solution: use enterprise integrations and standardized APIs to centralize feeds.
- Alert fatigue: Too many notifications reduce their usefulness. Solution: set meaningful thresholds tied to business-critical KPIs only.
- Data quality issues: Live dashboards amplify bad data instantly. Solution: implement validation layers before data reaches the dashboard.
- Change management: Teams accustomed to weekly reports may resist a shift to continuous monitoring. Solution: phase rollout with training and clear ownership.
- Security and access control: Live data exposure across teams raises governance concerns. Solution: apply role-based permissions and audit logging.
- Integration complexity: Legacy systems often lack modern APIs, making live connections difficult to build. Solution: use middleware or integration platforms designed to bridge older infrastructure with cloud-based dashboards.
None of these challenges are reasons to delay adoption. Most enterprise teams that succeed with live dashboards start small, connecting one or two high-value data sources before expanding scope. This incremental approach builds internal trust in the data and avoids the common mistake of trying to unify every system on day one, which often stalls projects before they deliver any value.
Cloud providers such as Microsoft and Google now offer built-in governance features that address several of these challenges out of the box, easing enterprise adoption.
Future Trends in Live Data Visualization Tools
The next generation of dashboards is moving beyond passive display toward active reasoning. Expect these developments to shape the coming years:
- AI-native summarization: Dashboards that generate plain-language explanations of trend changes automatically
- Predictive overlays: Live charts blended with forecasts, not just historical data
- Conversational interfaces: Asking a dashboard a question instead of building a custom filter
- Embedded automation: Dashboards that trigger workflows directly when a threshold is crossed
- Unified customer views: CRM, support, and product data merging into one live profile per customer
These trends align closely with the broader shift toward AI-native analytics platforms, a topic explored further in DTMetrix’s article on What is Predictive Analytics & How Brands Use It.
Best Practices for Business Intelligence Dashboards
To get lasting value from live dashboards, follow these proven practices:
- Start with three to five KPIs that truly drive decisions — avoid cluttered dashboards
- Assign clear ownership for each metric so action always has an accountable owner
- Validate data pipelines before launch to prevent early trust issues
- Design for mobile and desktop, since decisions often happen away from a desk
- Review dashboard relevance quarterly as business priorities shift
- Pair dashboards with automated alerts rather than requiring constant manual checking
Teams that combine these practices with strong customer support automation, such as the strategies in How AI Chatbots Improve Customer Support and Reduce Costs, often see compounding gains across both service quality and operational speed.

Frequently Asked Questions
What is the difference between a real-time dashboard and a standard BI report?
A real-time dashboard updates continuously as new data arrives, while a standard BI report reflects a fixed point in time and requires manual or scheduled refreshes.
How quickly do real-time dashboards actually update?
Most modern platforms update within seconds of new data arriving, depending on the underlying API and streaming infrastructure used.
Are real-time dashboards suitable for small businesses?
Yes. Many cloud-based platforms offer scalable pricing, making live dashboards accessible to small teams, not just large enterprises.
What data sources can feed a real-time dashboard?
Common sources include CRM systems, payment processors, marketing platforms, website analytics, IoT devices, and internal databases connected through APIs.
Do real-time dashboards replace the need for data analysts?
No. Dashboards surface live metrics, but analysts remain essential for interpreting deeper trends, validating data quality, and guiding strategic decisions.
Conclusion: Real-Time Data Dashboards for Business Decisions Start Here
Real-Time Data Dashboards for Business Decisions are no longer a luxury reserved for large enterprises — they are becoming a baseline expectation for any business that wants to compete on speed and accuracy. From eCommerce to financial services, live dashboards turn scattered data into a shared, actionable view that shortens the distance between insight and action.
If your team is still relying on static reports and delayed exports, now is the time to modernize. Explore DTMetrix’s full range of analytics and automation offerings on the Services page, browse more insights on the Blog, or Contact Us to start building a real-time dashboard strategy tailored to your business.